Using PowerScore for competitive performance reporting is quick and easy.
- Analyze the efficiency and productivity of grow operations with Performance Snapshots
- Generate environmental key performance indicators for portfolios of facilities for energy, water, and emissions impacts
- Compare KPIs against peer facilities with Competitive Facility Rankings
- Access the Cannabis Ranked Data Set and filter by state and climate zone, canopy size, and lighting and HVAC system type
Roll up system performance to the facility level to learn:
- Whole-facility energy consumption covering all energy sources (in kWh and kBtu)
- Annual facility energy use intensity (in kBtu/square foot)
- Equivalent greenhouse gas emissions footprint (in CO2eq)
Engineers: Use PowerScore dashboard reports to compare your clients’ performance relative to each other and to similar cultivators in their climate zone.

- Resource efficiency by cultivation approach, climate zone, size of facility
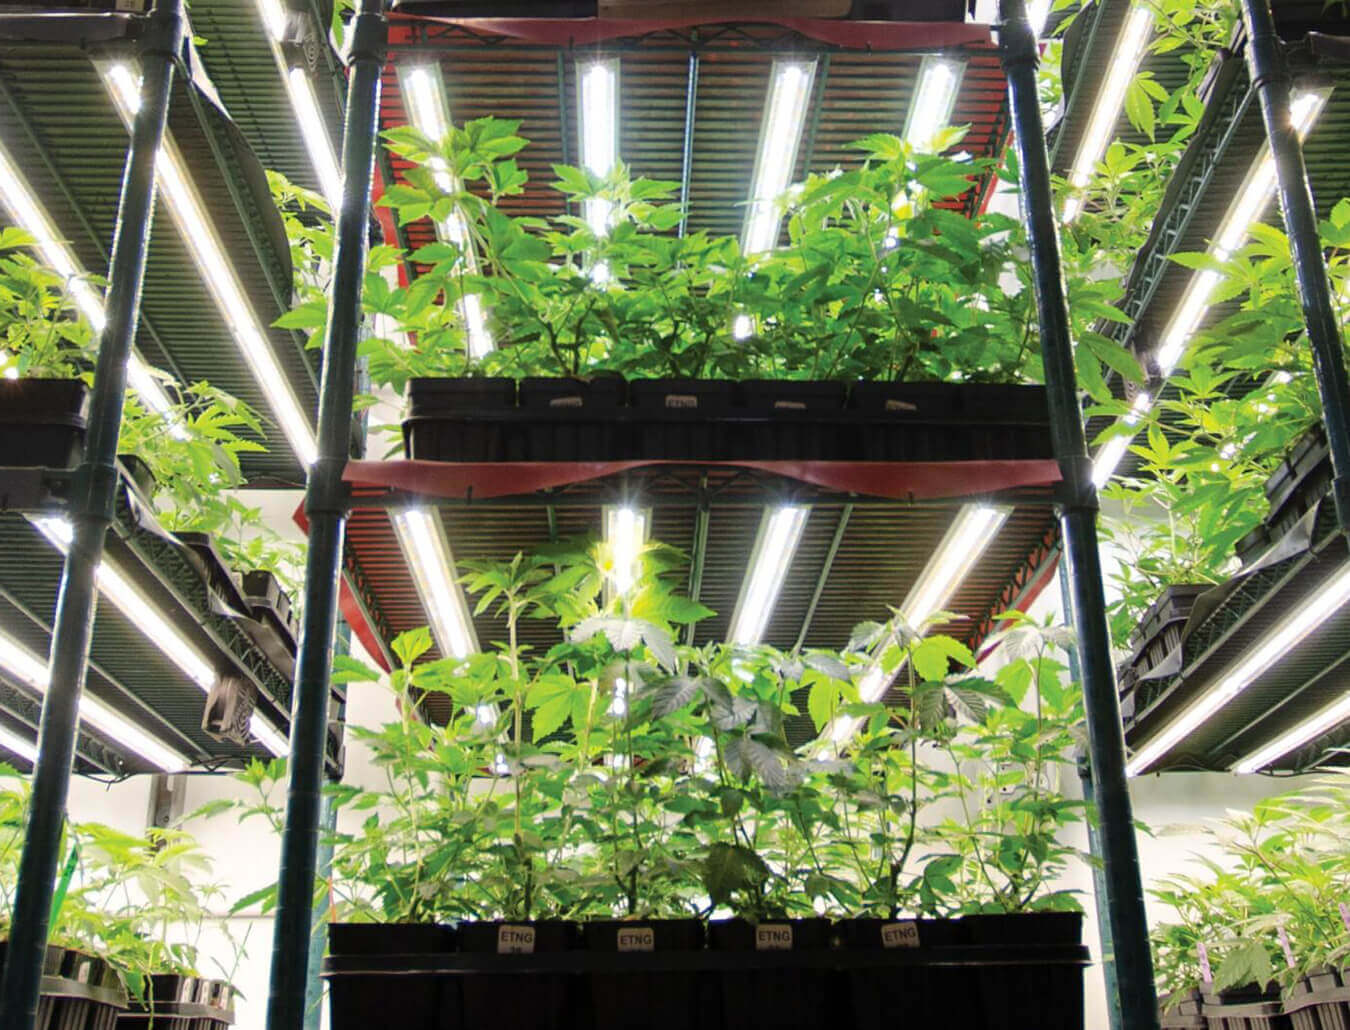
- Prevalence of vertical stacking, automation, and other innovative strategies
- Canopy size by market
- Technology adoption by facility type
- State-level performance to assess compliance with regional regulations
How It Works
Benchmark KPIs of indoor, greenhouse, and outdoor cannabis cultivation facilities to benefit from insights about efficiency and productivity.
Get started
on your efficiency journey by following these three easy steps.


